How we discover (and confirm) brand/product keywords
At LikeFolio, we have a love/love relationship with our social data. We know to make consumer insights valuable to companies and investors, we need to carefully curate and nurture data.
With such a large data sample size (over 500 million tweets a day) we have a HUGE base to sift through to create value. How do we do it? Peek into our research lab….
Step 1: Discoverability Testing
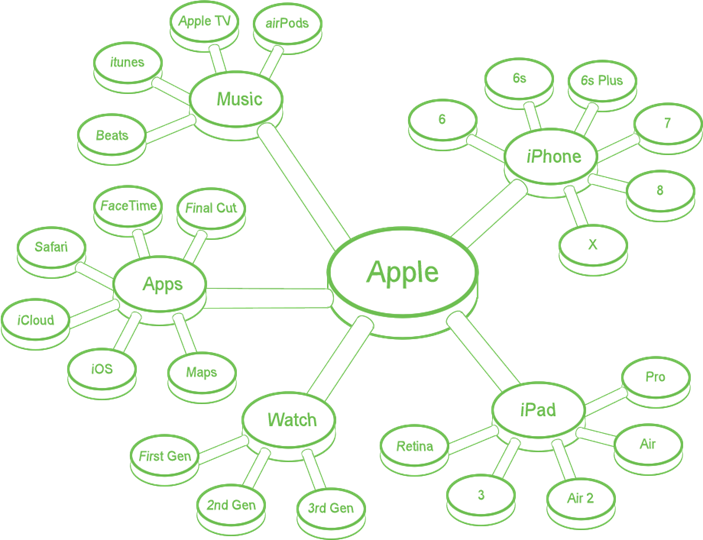
After all brands and products are identified, it’s time to dive into Twitter. Scanning tweets for mentions of “Facebook” is cake. Quickly spotting mentions of “Apple” is a different ballgame. A query for “Apple” will reveal tweets about the company, the snack, the childhood board game, and plenty of colloquialisms.
For data to have value for Apple (the company), we need to isolate ONLY mentions of Apple brands, products and services. This requires a mix of Boolean logic and custom keywords.
Step 2: Natural Human Language Application
How do consumers talk about brands and products? Not necessarily how are they supposed to speak about products (“Apple Watch Series 4”), but how do people actually speak about using products and services (“closed my rings”).
Insider tip: not all consumers are experts in grammar, spelling, or formal product names. We search Twitter and use real talk to create thousands of custom keywords to build the largest and most accurate sample size possible for each brand and product within a company.
Step 3: Tweet Sample Analysis
After we’ve identified all potential custom phrases for a company, we test them again with extensive tweet samples and human analysis. Really, our team of humans reads THOUSANDS of tweets. We make small tweaks to our own logic to refine our data sample when warranted and eliminate any non-consumer and non-brand related activity.
Step 4: Data Integrity Check
Once initial data is aggregated, we review tweets on high-volume dates. We annotate each of these dates on the dashboard to provide an explanation for cause of high volume and allow for a “correction” on the dates we feel may be media, marketing or politically related.
We allow Research Dashboard users to turn corrections on and off instead of eliminating these mentions entirely because the conversations can still be relevant indicators for a company.
Step 5: Repeat
When our data gets a final stamp of approval, it doesn’t stop growing. We are constantly scanning for shifts in how consumers discuss brands and products and track all new product releases.
We update each company on a regular basis (bimonthly) to keep our data up to speed and predictive.
Comparing Apples to Apples(see what I did there)
Our methodology ensures accuracy but also means that sometimes we produce a much smaller sample size for companies with brands and products that aren’t easily discoverable vs. companies with brands and products with unique names.
So, a company’s raw mention volume should only be compared against itself – that’s where the relevant trend/change is revealed. For comparisons between brands/products, we suggest looking at rates of change in each dataset to see which companies/brands/products are gaining (or losing) the most traction with consumers.
Our Unique Edge
Stock sentiment analysis and consumer sentiment analysis are relatively new fields, especially when viewed through the lens of social media data. Before reading you may want to familiarize yourself with how LikeFolio works, and what we mean by sentiment.
What is stock sentiment analysis?
Stock sentiment is a measure of how bullish or bearish (positive or negative) people are regarding the stock itself. We measure this through analysis of tweets that contain "cashtags" -- which is how Twitter users identify stock ticker symbols in their tweets.
Through stock sentiment analysis of every tweet containing a specific cashtag, we can effectively measure how investors and traders are feeling about the outlook for the stock itself.
What is consumer sentiment analysis?
Consumer sentiment is a measure of how happy or unhappy people are regarding the products and services that the company makes. This is measured through analysis of tweets that contain brand or product keywords from our proprietary brand to company database.
Through our partnership with Twitter, we take in millions of tweets about brands and products, rate each one for consumer sentiment (if possible), and from there we are able to determine overall consumer sentiment for that brand/product... and therefore for the company as a whole.
Through consumer sentiment analysis of every tweet mentioning a brand or product owned by a public company, we measure how consumers are feeling about the goods and services a company sells.
Note -- consumer sentiment (happiness) is a different metric than purchase intent, which is our most valuable metric. Both are important in analyzing consumer behavior and understanding how well a company is doing.
The differences are enormous
Stock sentiment analysis tells you what investors think about the stock itself. That can be valuable information, as long as you know how to use it properly (hint: being a contrarian on that data is usually the best play)
Consumer sentiment analysis tells you what real people on main street think about the products the company makes. This is incredibly valuable, because it gives us insight into how the company is doing on Main Street BEFORE they report their sales and earnings on Wall Street. Snapchat's consumer revolt is a phenomenal example of this happening.
There are lots of companies working on stock sentiment analysis. Because it's relatively easy to do. You have one ticker symbol to search for and analyze, whereas consumer sentiment analysis like we do requires the creation of a brand to company map containing tens of millions of keywords and tags!
Consumer sentiment and insights on consumer behavior is difficult and infinitely more valuable to traders and investors. That's why we are so proud of our data and our ability to offer it to our members.
Data & Scoring Overview
SCORING
VOLUME data is a Score from 0 up. The higher the score, the more tweets were counted in that data series.
Sentiment data is a percent positive score from 0-100. The higher the score, the more positive tweeters are about the brand/product/cashtag.
This is the calculation (# of positive tweets)/(# positive tweets + # of negative tweets). Note that neutral tweets are not used in this calculation.
Sentiment scoring is used in Consumer Happiness Mentions. Sentiment can be delivered as this score, or as a volume score by Sentiment type (Neutral, Positive, Negative)
METHODOLOGY
Consumer Buzz (Mention Volume): A tweet is counted as a mention if it contains a reference to a brand/product owned by the company.
Note-- A single tweet that contains two brand mentions (e.g. “Should I take my iPhone or iPad? ”) would count as +1 for each of the brands, which would then combine to count +2 for the company as a whole.
Consumer Purchase Intent Volume: A tweet is counted as purchase intent and counts toward Consumer Purchase Intent Volume totals if it contains a reference to the brand/product along with a word/phrase that indicates purchase.
We maintain a database of purchase intent words/phrases for each product type. For example, “got a new iphone 7” would count as a purchase intent mention for iphone 7, and “Made reservations for our Disney World trip!” would count as a purchase intent mention for Disney.
Consumer Happiness: A tweet is counted as a positive tweet if it contains a word/phrase in our list of consumer positive words/phrases, and negative it it contains a word/phrase in our list of consumer negative words/phrases. Tweets that do not contain words/phrases from either list are counted as neutral.
Aggregation: Each tweet score is assigned to a brand/product. For volume calculations, we add up all brands/products owned by the company into a single company score.
For sentiment calculations, we do the same (all positive mentions/all positive + negative mentions) for the company
Increments: Score by company is available in the following increments: hourly, daily, weekly, monthly.
Weighting: “Base” data is converted to “Tweets per million” data by dividing the “base” data count by the adjusted total number of tweets in the LikeFolio system for that same time period, then multiplying by 1,000,000.
(adjusted total excludes large product/brands whose shifts can drastically alter the number of tweets in the system, like “iphone” during Apple events for example)
The purpose of this “tweets per million” approach is to normalize the data over time periods of varying total twitter usage. This way our data is consistent whether it is evaluating a high-volume time period like a weekday evening, a low-volume time period, or whether or not Twitter grows in usage.
Breakdowns: Score can be broken down by brand inside of a company. Score can be broken down by division of company.
Rollups: Score can be sent as total score for sector by combining companies in that sector.
Timeframe data metrics: We return the requested score (sentiment, cashtag volume, etc) as described above for the requested time period.
When we talk about Consumer Buzz, we are talking about the total number of qualified mentions of the brands/products that a company makes in a given time frame.
Example: "Consumer Buzz scores jumped 11% in February" means that we saw 11% more activity in social media about the brands and products that the company makes.
When we talk about Consumer Happiness, or "social sentiment", we are talking about mentions of brands that contain words or phrases that are either positive or negative in nature.
Example: "I love my new iPhone" would be considered a positive tweet about iPhone and therefore be mapped back to Apple ($AAPL.)
We have a huge, proprietary universe of keywords and phrases. Some are scored more highly positive than others.
Example: "I love the new iPhone I just bought.“ would be considered a positive tweet and be scored more positive than the previous example because it contains multiple positive indications, including a consumer purchase intent mention.
The mention is scored as a whole, so multiple sentiment keywords and phrases are considered in the final tally for the mention. We score both positive and negatively.
Example: "I love my iPhone but hate that it always drops calls” would be considered a negative tweet because its negative sentiment phrases have a higher weight than its positive keyword scores.
Consumer Happiness Score
LikeFolio delivers consumer happiness mentions as three unique datasets: # of positive mentions, # of negative mentions, and % happiness
LikeFolio Consumer Happiness Data is available in our research dashboard, and contributes to many of our opportunity alerts.
Consumer Purchase Intent Mentions
What is a Consumer Purchase Intent Mention?
When someone says something on social media that leads us to conclude they either 1) intend to buy a product/service in the future or 2) recently bought a product/service, we call that a Purchase Intent Mention.
How do you know the person is purchasing?
We very specifically look mentions of the brand/product with phrases indicating purchase intent… like “just got a”, “getting a new”, “bought”, etc.
LikeFolio also differentiates between product types, so that a purchase intent mention for an iPhone (e.g. "bought a new iphone") will be different from the purchase intent mention of a restaurant (e.g. "got reservations at Olive Garden").
How can I use purchase intent in my research?
Purchase Intent is even more important (and predictive) than consumer buzz and consumer happiness, because it is a live look into actual consumer spending behaviors.
Fund managers use purchase intent through the LikeFolio API, looking for trends and shifts over time. Others with less computational horsepower utilize LikeFolio On Demand to get the data on demand as part of their research process.
LikeFolio is proud to be a preferred partner in the Twitter data ecosystem. This relationship gives us many powerful advantages in spotting consumer trends on Main Street, before they become news on Wall Street.
Consumer Insights
Twitter is one of the most powerful social networks in the world, utilized by over 325 million users on a monthly basis.
More importantly, these users are often discussing their real-life interaction with brands and products in a direct and meaningful way. This allows us to "listen in" on the conversation and glean important insights directly from consumers.
Data reliability
LikeFolio has direct access to the full Twitter firehose in real-time. Unlike other alternate data providers, we don't rely on shady and inconsistent web-scraping. We get tweets directly from the source in real-time, insuring that our data is clean, accurate and always on.
Historical data
Because of this relationship with Twitter, LikeFolio has full access to historical data from Twitter as well. This allows us to fulfill our promise that every company we cover will have full and accurate historical data all the way back to January 1, 2012.
Protecting user privacy
LikeFolio only receives tweets that Twitter users intentionally published for public consumption. We do not rely in any way on data collection tactics that would violate the privacy expectations of the originating user.