Breakdown of the Sunday Earnings Sheet
LikeFolio Earnings Predictions are sent via our famous Sunday Earnings Sheet every Sunday during earnings season, covering the week ahead. Here's what a typical Sunday Earnings Sheet will look like:
Cover sheet:
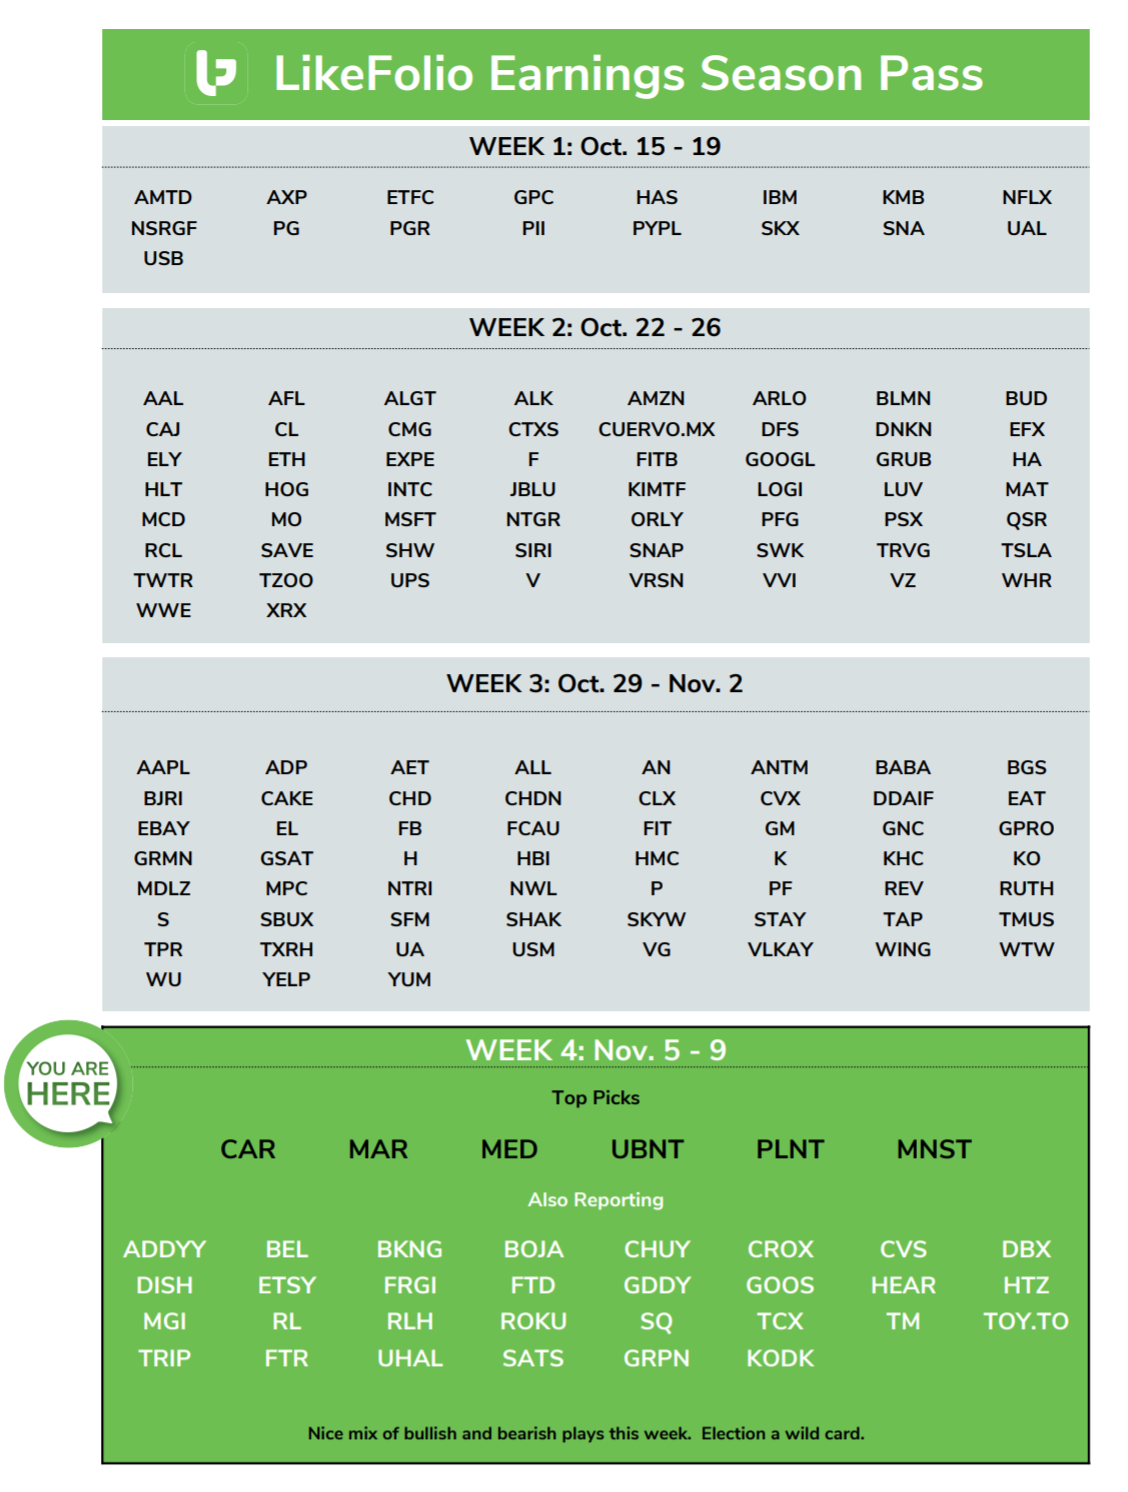
The cover sheet simply lets you know where you are in the current earnings season, and gives a brief overview of who is reporting this week along with some quick commentary on the week ahead.
Predictions Sheet
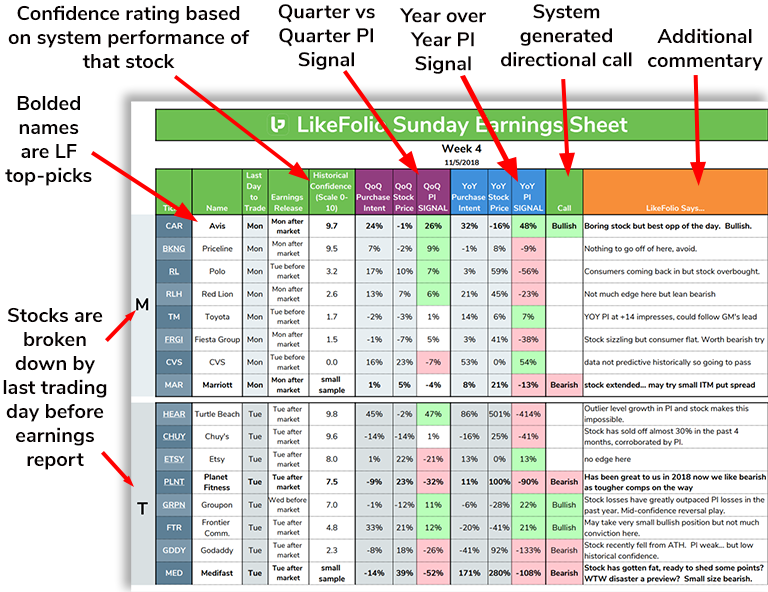
The predictions are broken down by last day to trade prior to the earnings reports. For example, all of the companies who report on Monday after the bell and Tuesday before the open will be bucketed together in the Monday group.
Each company has its own row, giving a breakdown of all of the data that went into that company's prediction (or non-prediction in many cases).
Bolded names are LikeFolio staff's top picks for that day.
Historical Confidence is a score (0-10) given to each stock based on the performance of that particular stock in our Earnings Trading System (learn more about methodology). The higher the score, the better our data has been at predicting that stock's earnings movements in the past, based on % of time direction was correct as well as the size of the moves.
Quarter over Quarter data is provided. This shows the movement in purchase intent mentions and movement in the stock price over the duration of the quarter to be reported, as of the last day of that company's fiscal quarter. Remember, it's up to you to account for pre-release earnings movement.
QoQ PI signal is difference between those two quarterly numbers. A negative result indicates that the stock has outperformed the underlying purchase intent data. A positive score indicates that the stock has underperformed the purchase intent data. Positive is bullish going into the earnings report, negative is bearish.
Year over Year data is provided. This shows the movement in purchase intent mentions and movement in the stock price for the quarter to be reported compared to that same quarter a year ago. All data is as of the last day of that company's fiscal quarter. Remember, it's up to you to account for pre-release earnings movement.
YoY PI signal is
Call is the directional prediction of the Earnings Trading System. This is purely a mechanical call using the system studied in the Likefolio White Paper.
IMPORTANT Seasonality Impact: One of the shortcomings of the Earnings System as defined in our white paper is that it doesn't do a great job of adjusting for seasonality (in the system, QoQ and YoY MUST agree on direction). When looking at the numbers on highly seasonal companies, we suggest giving higher priority to YoY data. This could allow for the identification of opportunities where the system itself produces no official call. To test for seasonality, look at purchase intent mentions in the LikeFoio Research Dashboard. Truly seasonal businesses (GOOS is a great example) will have "waves" of purchase intent with distinct peaks and valleys each year.
LikeFolio Says... is commentary from Likefolio team members with extensive experience using the data to place earnings trades. This section is designed to give you a view into how experienced traders react to the provided data. In here we will add color to the data. We may state reasons against being aggressive on a system call, or provide notice of an opportunity that the system data did not see (usually due to seasonality).... we may even put specific trade ideas or entry/exit point projections into this area.
Bottom line -- The LikeFolio Sunday Earnings Sheet is one of the most powerful documents produced for active investors and traders, and yet it is not a replacement for doing your own research, analysis